
This section extends the Equity Profile knowledge base article with guidance on identifying and interpreting a suspended share price, including where this status appears across the platform and a worked example.
Where to find share price status
Share price status — including whether a stock is trading normally, or has been suspended — is shown consistently in three places in the platform:
- Snapshot Profile → Share Info panel
- Equity Profile → Stock Fundamentals panel
- Health Profile → Share Info panel
In each location, if a company's shares are not currently trading, the Share Price field will read "Suspended" followed by the price at which the stock last closed before the suspension (e.g. "Suspended – Closed ).
Understanding a Suspended Share Price A suspended share price means trading in the company's shares has been formally halted. It does not necessarily mean the company has failed, but it always means the market is temporarily or permanently unable to buy or sell the stock.
Forced pause by the exchange or regulator
The Financial Conduct Authority (FCA) or the London Stock Exchange (LSE) has ordered trading to stop immediately. No one can buy or sell the stock while the suspension is in place.
Common reasons for a trading suspension
- Major unexpected news is about to be released, and trading is paused so that all investors have equal time to read and react to it fairly.
- The company has failed to publish its financial reports (e.g. annual accounts) on time.
- On the AIM market, the company has lost its Nominated Adviser ("Nomad") — AIM companies are required to retain one at all times.
- Serious regulatory investigations, financial distress, or severe market confusion about the company's true position.
A suspension can be temporary, lifted once the triggering issue is resolved, or it can become permanent, most commonly when the company enters an insolvency process such as liquidation or administration.
What the Share Price chart shows for a suspended company
Once a share is suspended, the Share Price chart on the Equity Profile page stops updating, while the H-Score trend on the left of the page continues to be calculated from filed accounts.
A suspended company will not always show "Data unavailable" on the chart. What you see depends on whether the suspension happened before or after our share price data begins.
|
Our share price data starts on 1 May 2026 If a company was suspended before 1 May 2026, the chart shows "Data unavailable". If a company was suspended on or after 1 May 2026, the chart shows its share price from 1 May 2026 until the date it was suspended. |
Worked example: WorldLink Group PLC
WorldLink Group PLC (company number 06448562, ticker WGP, LSE) illustrates a permanent share price suspension. The screenshots below show how this appears across the platform.
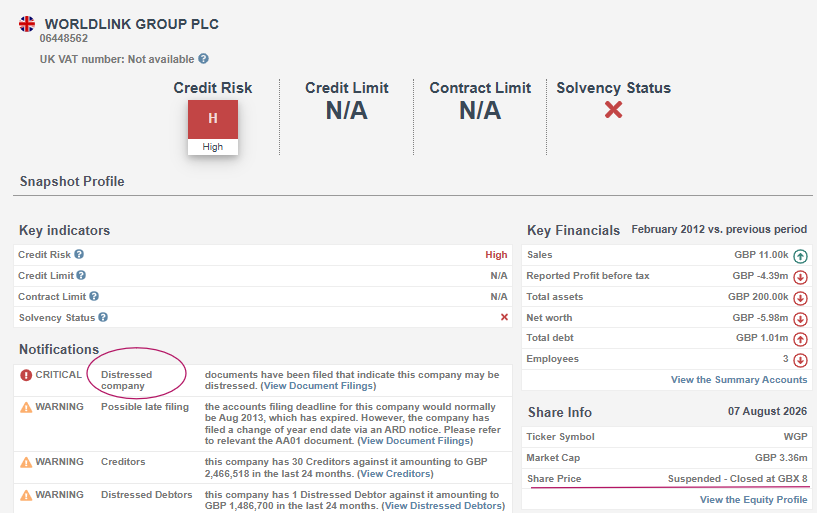
The Snapshot Profile also flags this company as a "Distressed company" under Notifications, with Solvency Status marked with a red cross — both consistent with a company that is no longer trading normally.
Equity Profile — Stock Fundamentals
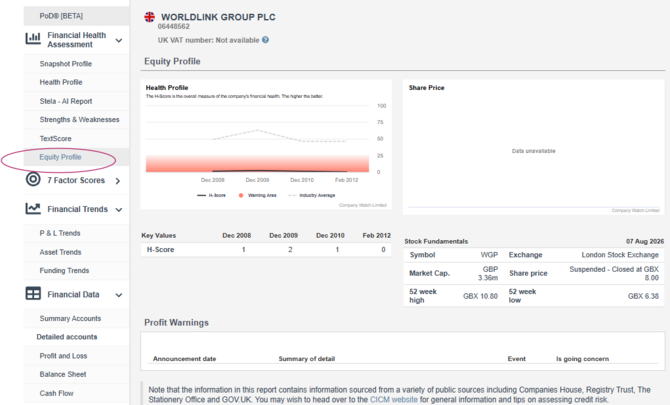
Because WorldLink Group PLC was suspended before 1 May 2026, there is no share price history to display, so the Share Price chart shows "Data unavailable".
Why the share price is stopped for WorldLink Group PLC
WorldLink Group PLC went into liquidation.
Permanent delisting
When a public company enters liquidation, it can no longer trade on the London Stock Exchange.
Its shares are permanently suspended and removed (delisted) from the market.
What this means for shareholders
- Trading is over: shareholders cannot buy or sell these shares on the open market anymore.
- Value of shares: in a liquidation, ordinary shareholders are last in the queue to receive any leftover money. Secured lenders, suppliers, and tax authorities must all be paid first.
Worked example 2: suspended after our data starts
Windar Photonics PLC (company number 09024532, ticker WPHO, LSE) shows what you will see when a company is suspended after 1 May 2026.
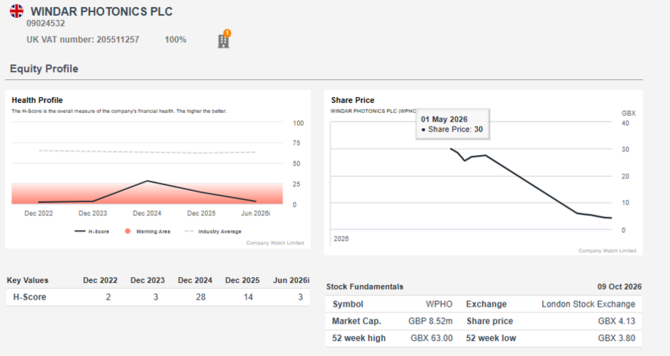
Instead of "Data unavailable", the Share Price chart shows a line. It starts on 1 May 2026, when our share price data begins, at a price of 30 GBX. It then follows the share price down until the shares were suspended, at which point the line stops.
The H-Score trend on the left continues to be calculated from filed accounts and does not depend on the share price.
|
Key point A share price line on the chart does not mean a company is trading normally. Always check the Share Price field in Stock Fundamentals, Snapshot Profile or Health Profile to confirm whether the shares are suspended. |