
Financial Health Assessment → Equity Profile
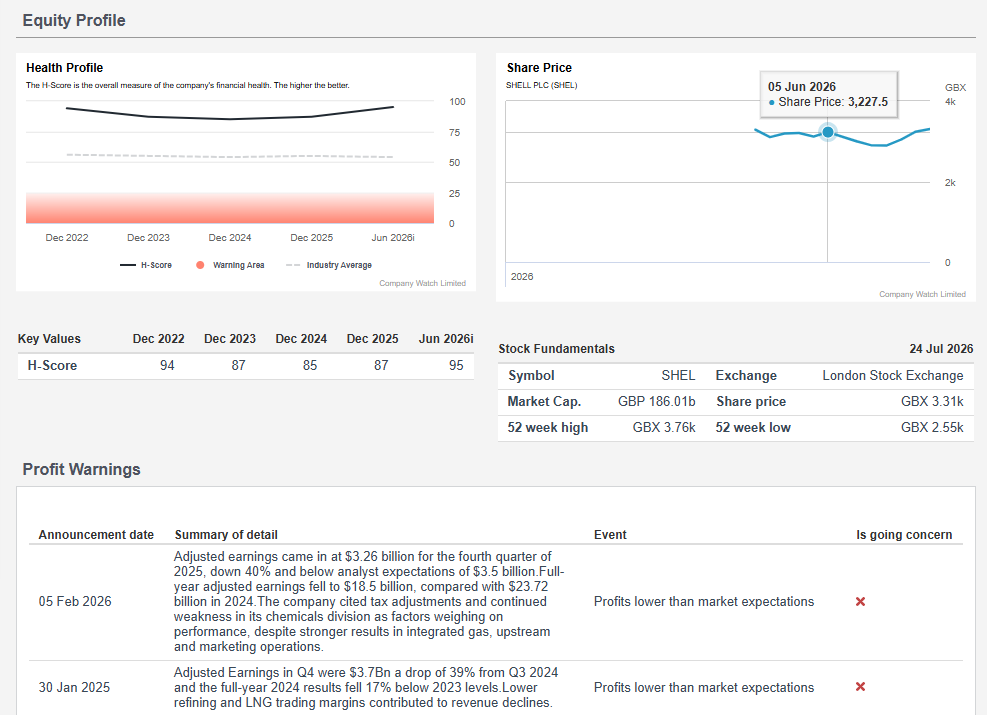
The Equity Profile section combines Company Watch’s financial health analysis with market data to provide additional insight into how the market values a company compared with its underlying financial strength.
What information is available?
The Equity Profile page includes:
- Historical share price movement charts
- H-Score trend comparison
- Symbol
- Market Capitalisation (Market Cap)
- Exchange
- Share Price
- 52 Week High
- 52 Week Low
The chart allows users to compare the company’s financial health against market sentiment over time.
How to use Equity Profile information
The Equity Profile should be used as part of your wider company evaluation process.
Consider the following key questions:
- Has the market detected any problems, or is the market perhaps missing the company’s fundamental weakness or strength as identified by the H-Score?
- When the financial strength of a company diverges from the market perception of its future strength, this is usually worth further investigation.
For example:
-
Has the market identified a potential issue before it becomes visible in the financial statements?
-
Is the market simply revaluing a previously overvalued or undervalued company?
-
Has the market overreacted to recent news?
-
Do the financials support the market concern?
- Has a significant event occurred after the latest accounts were published?
Equity volatility
Changes in share price can sometimes highlight market concerns or expectations that are not yet fully reflected in the accounts.
In cases where a rise in the share price is accompanied by a deteriorating H-Score, this may indicate one of the following:
-
The market has missed the underlying vulnerability
- The market is placing high value on acquisitions or future expectations rather than current financial fundamentals
Equally, a falling share price alongside a stable or improving H-Score may indicate that the market has overreacted.
Tips: Use the Financial Experiment facility to test the impact of potential changes, such as:
- Profit warnings
- Revenue decline
- Increased borrowing
- Margin pressure
This can help assess how sensitive the company’s financial health may be to future events.
Example
Below is an example of the Equity Profile section for a quoted company, showing the H-Score trend alongside share price and stock fundamentals.
To find out what is meant by a Suspended Share Price, read the article Understanding a Suspended Share Price.